
The payment success index 2020: a UK & Ireland spotlight
Last editedAug 20202 min read
We recently analysed the global payment success data from over 55,000 GoCardless customers, to better understand payment failure rates and recovery rates across all kinds of businesses that collect recurring payments.
The global report is available here, but we also analysed the data from our UK & Ireland customer base to see how this region compares to the global outlook. This regional spotlight sheds a light on five of the most compelling insights from the UK & Ireland market:
1. UK & Ireland failure rates are better than the global average.
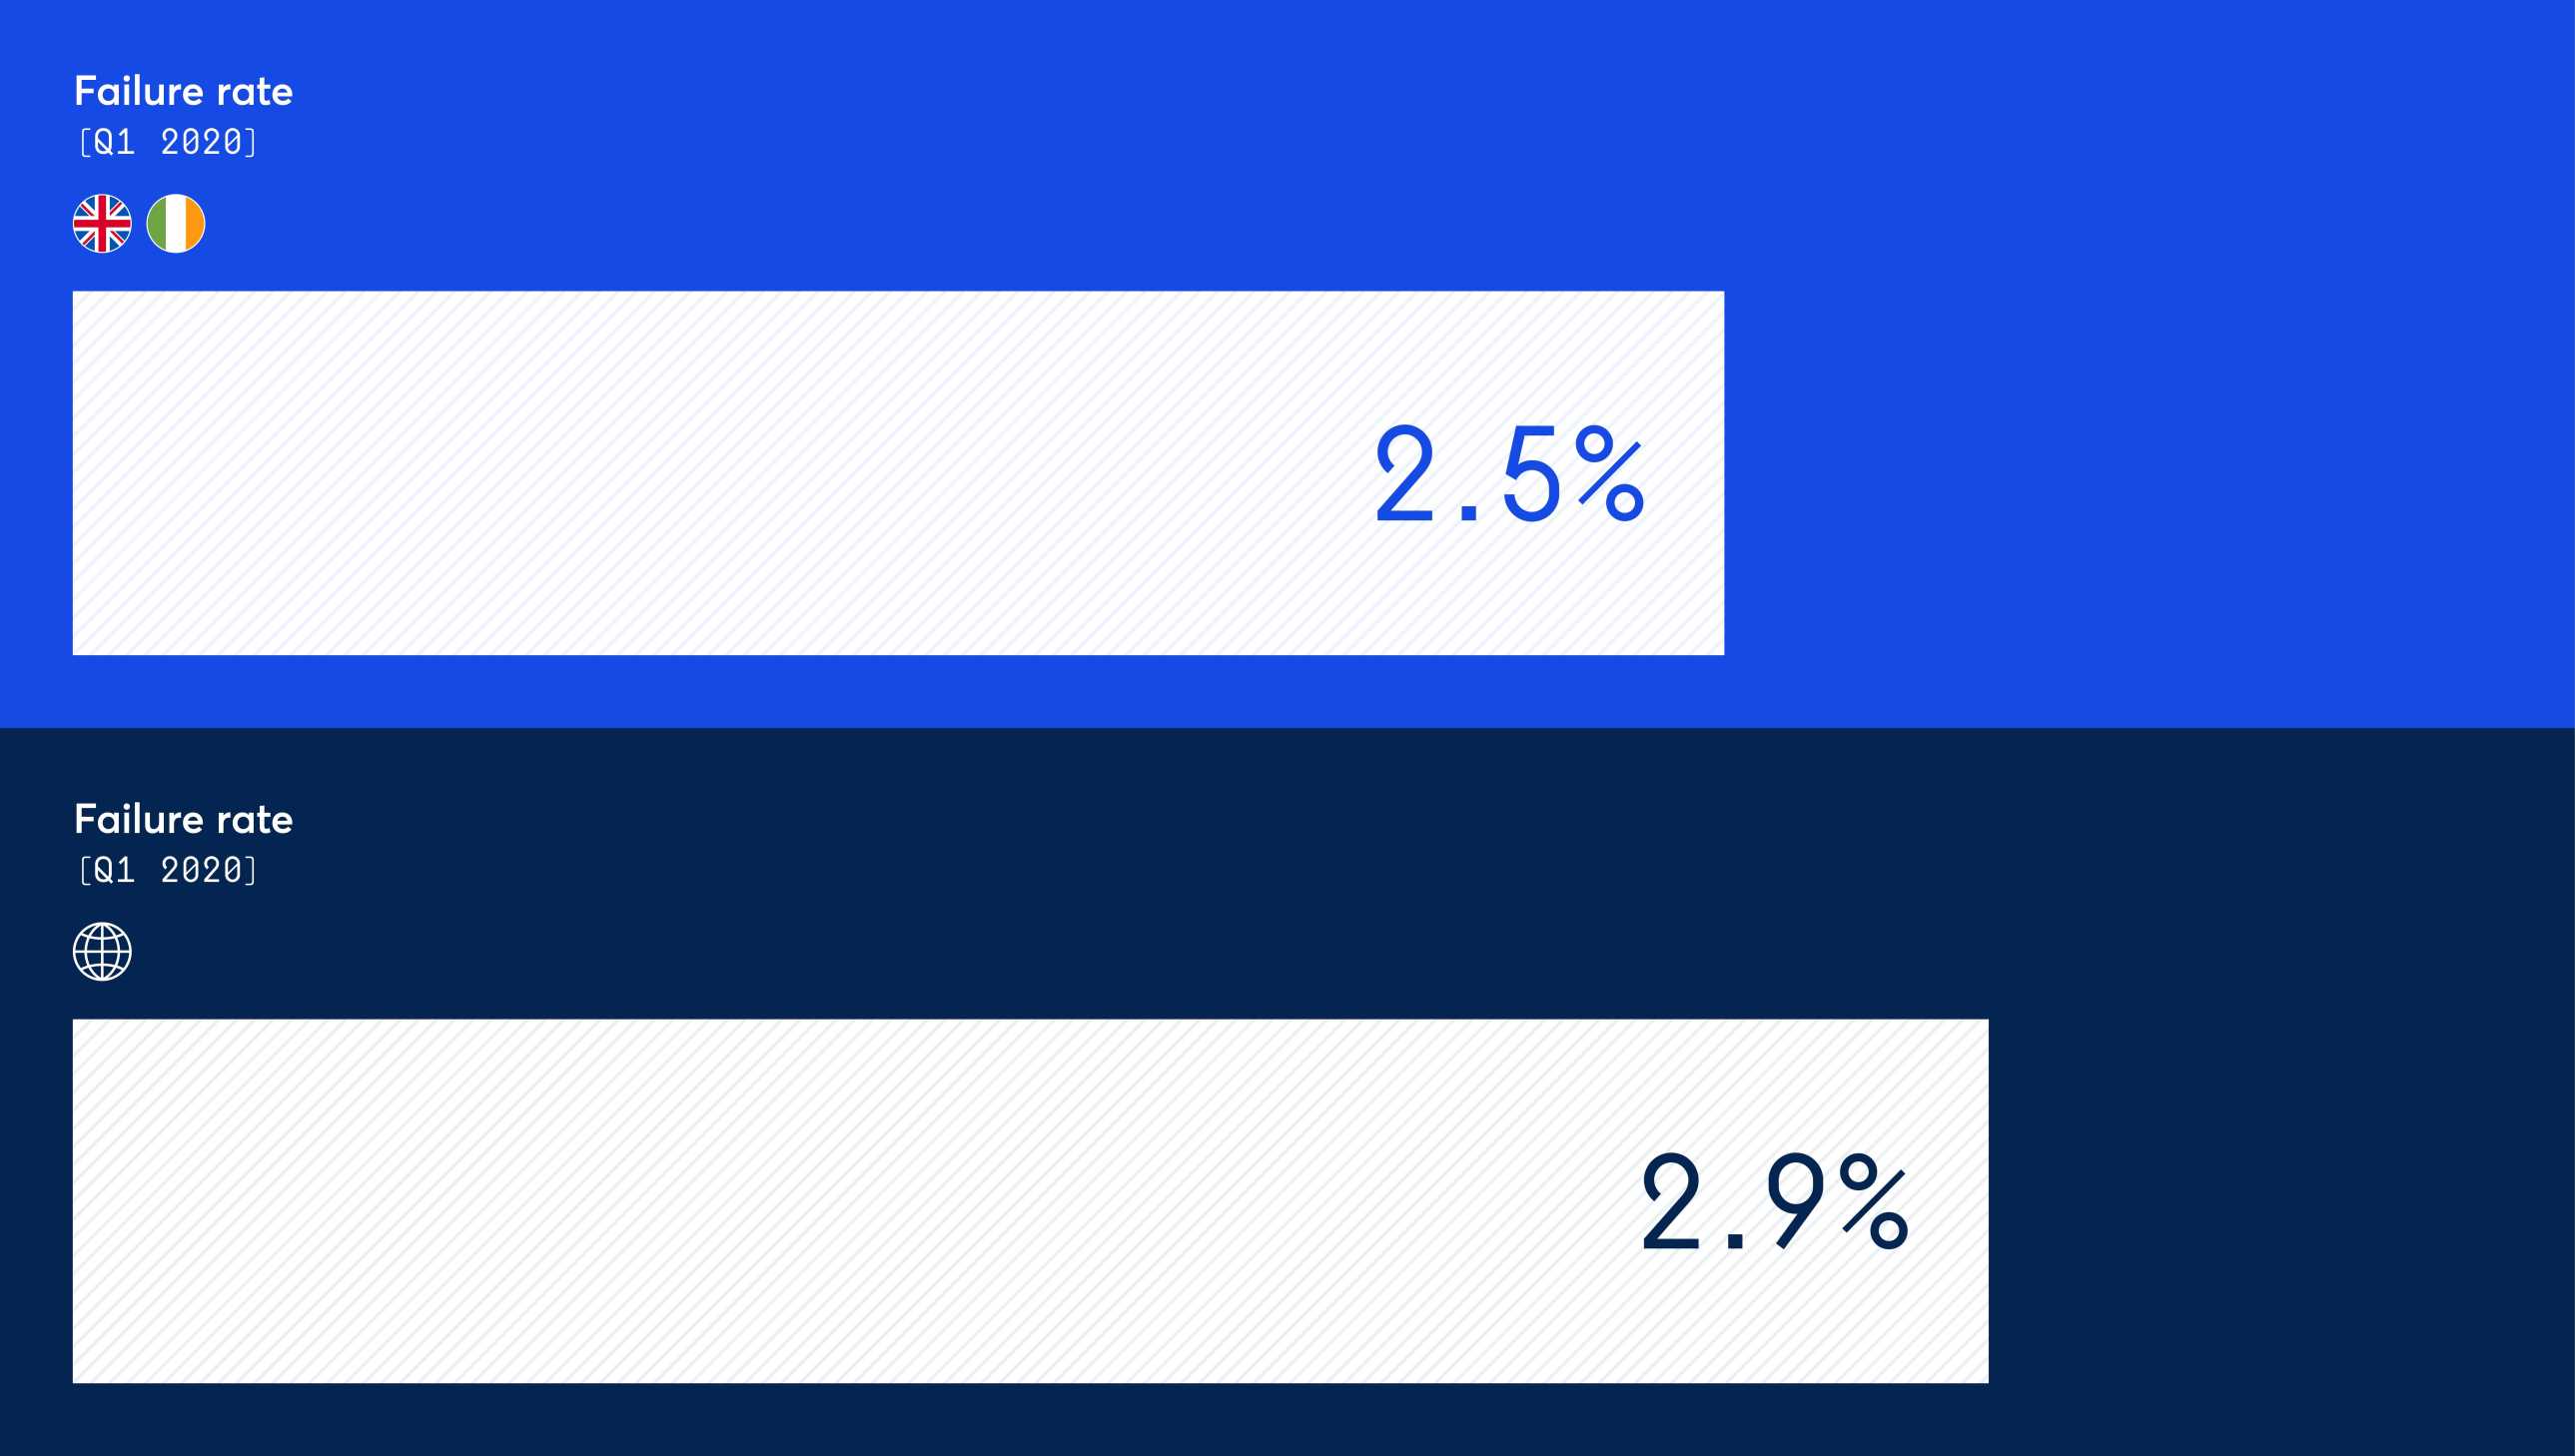
The global payment failure rate for Q1 2020 was 2.9%, whereas in the UK & Ireland the payment failure rate for the same period was only 2.5%. Compared to 2019, failure rates have risen slightly, up from 2.4%. This is consistent with the global trend (2.8% in 2019).
2. UK & Ireland businesses recover 35% of failed payments with a single retry.
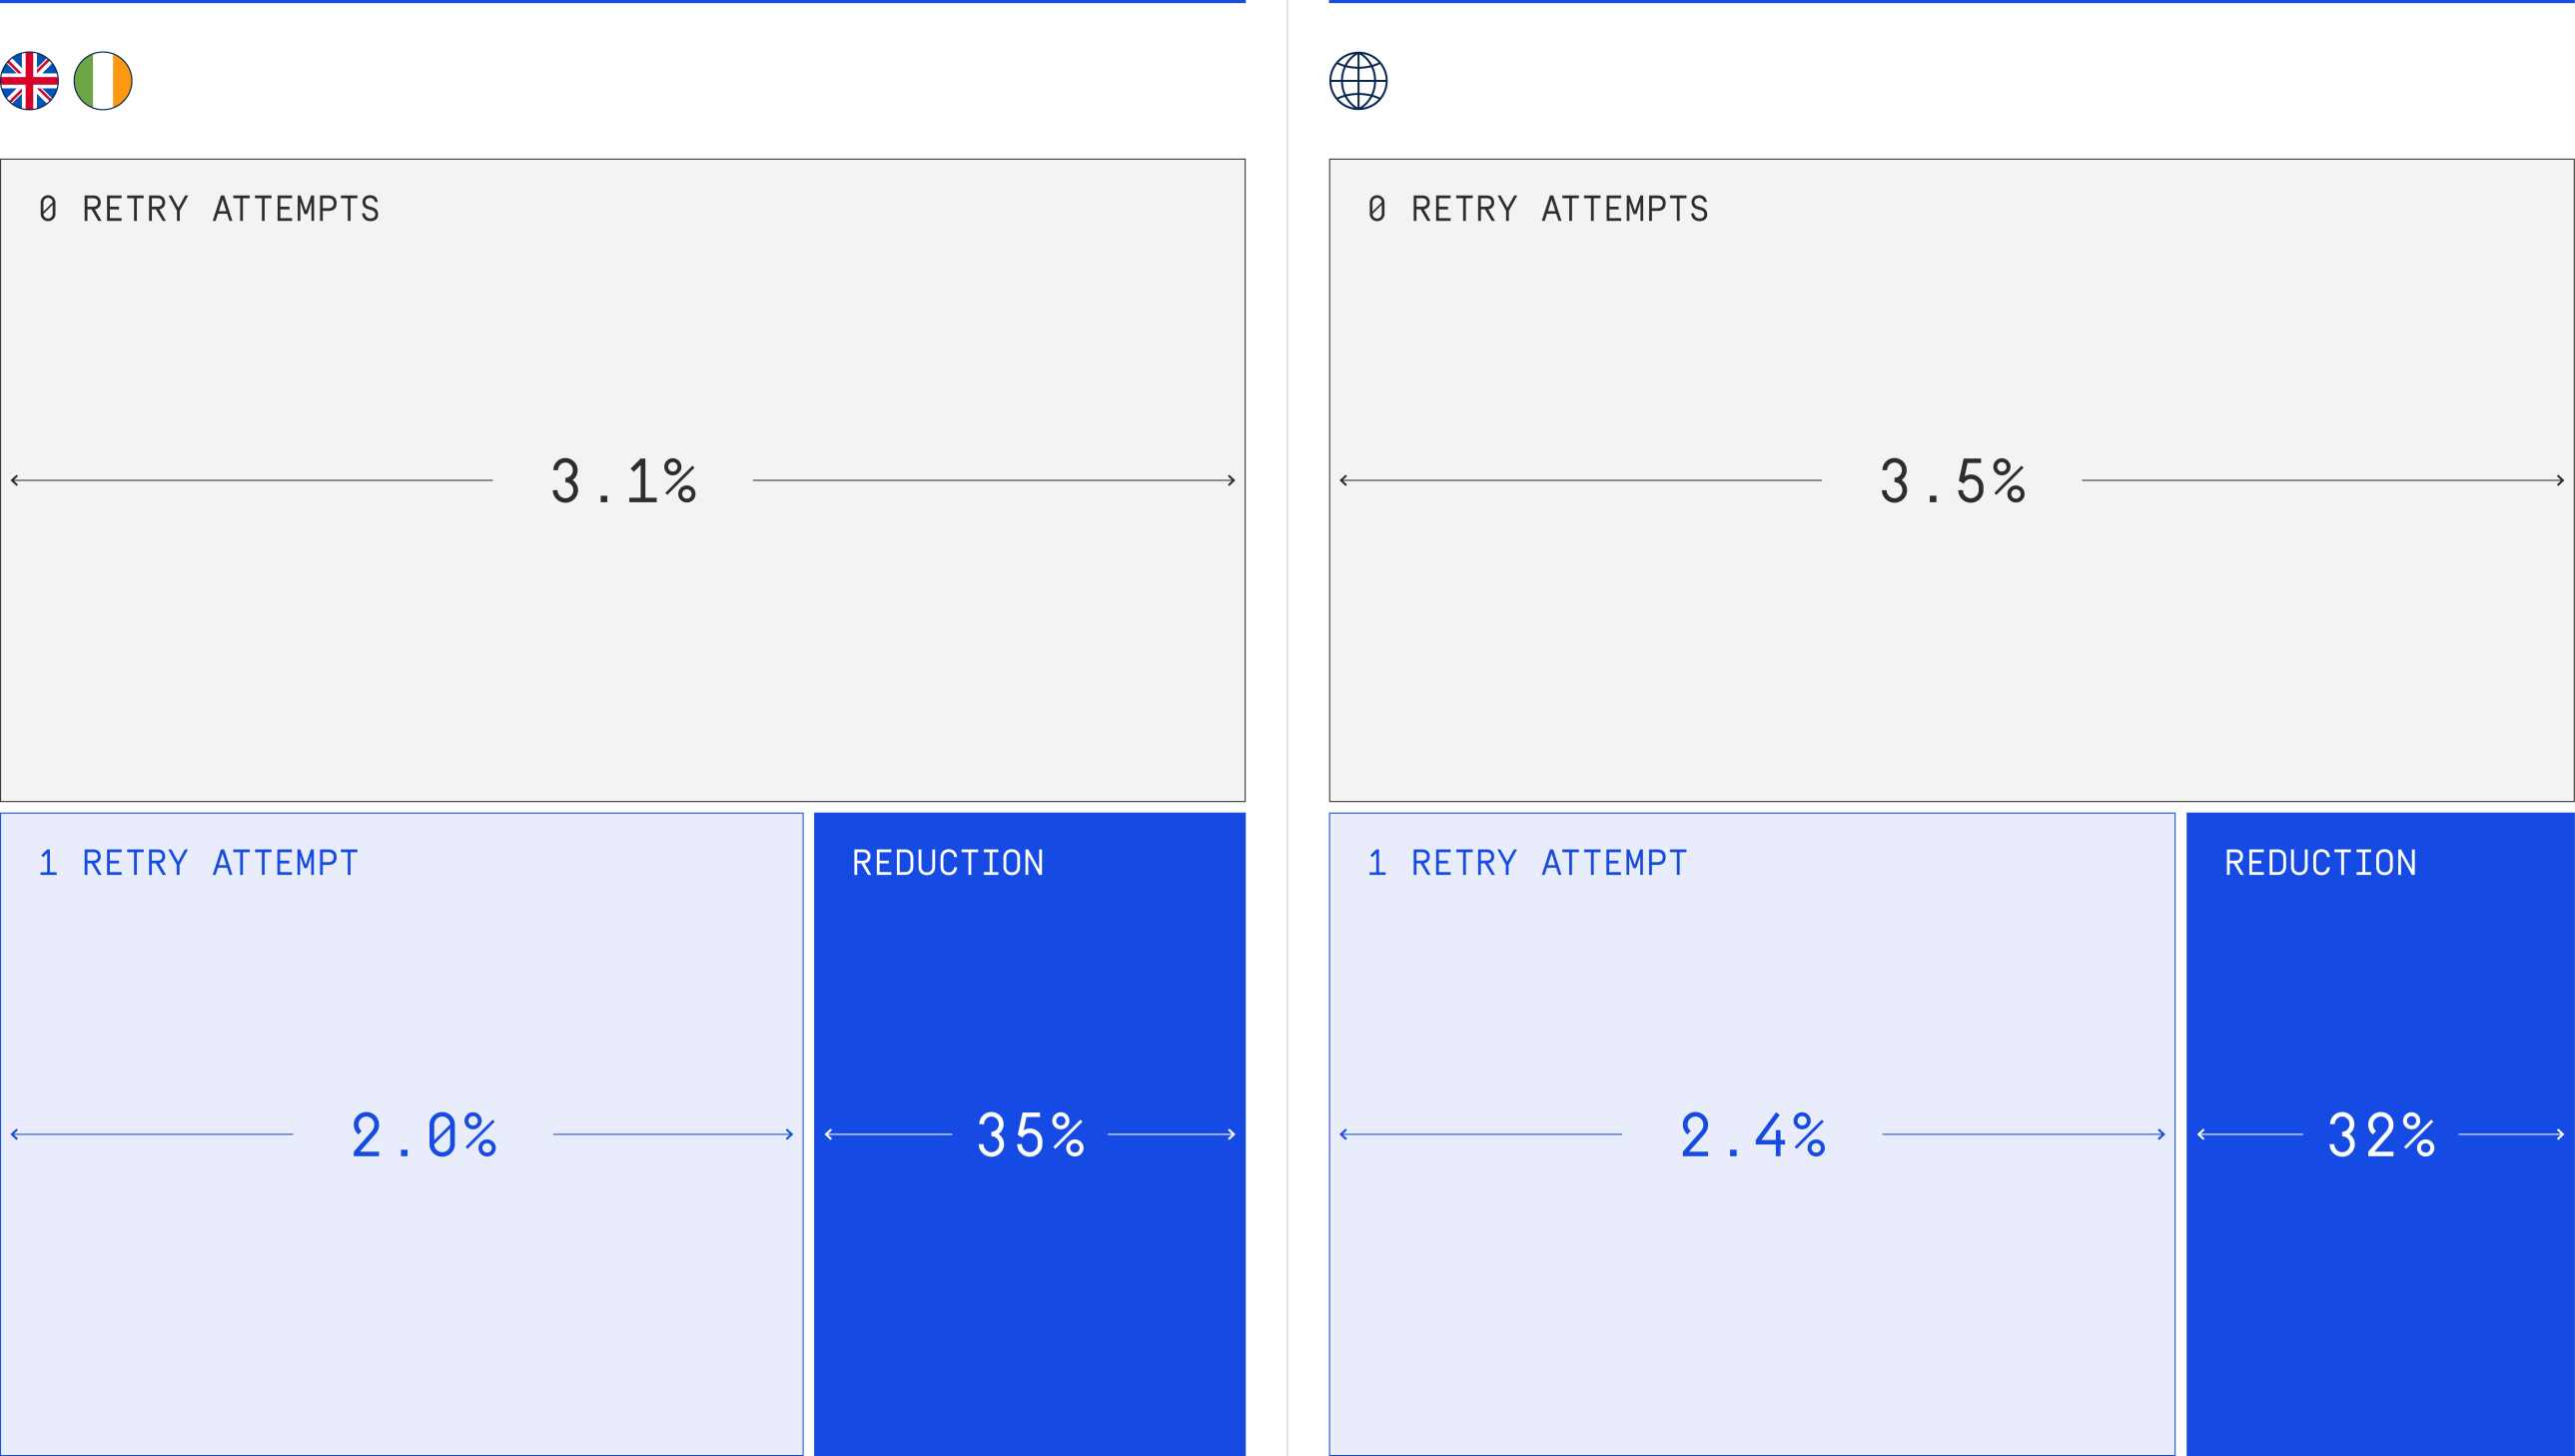
A business in the UK or Ireland that does not retry payments can expect to see a failure rate of 3.1%. However, when a business makes a maximum of one retry attempt per failed payment, it can expect to see a payment failure rate drop to just 2%. This represents a 35% drop in failure rates due to a simple payment retry.
While there is no silver bullet for reducing payment failure rates, payment retries are a reliable way to collect many of the payments that would otherwise go uncollected.
3. GoCardless payments compare favourably to other payment methods.
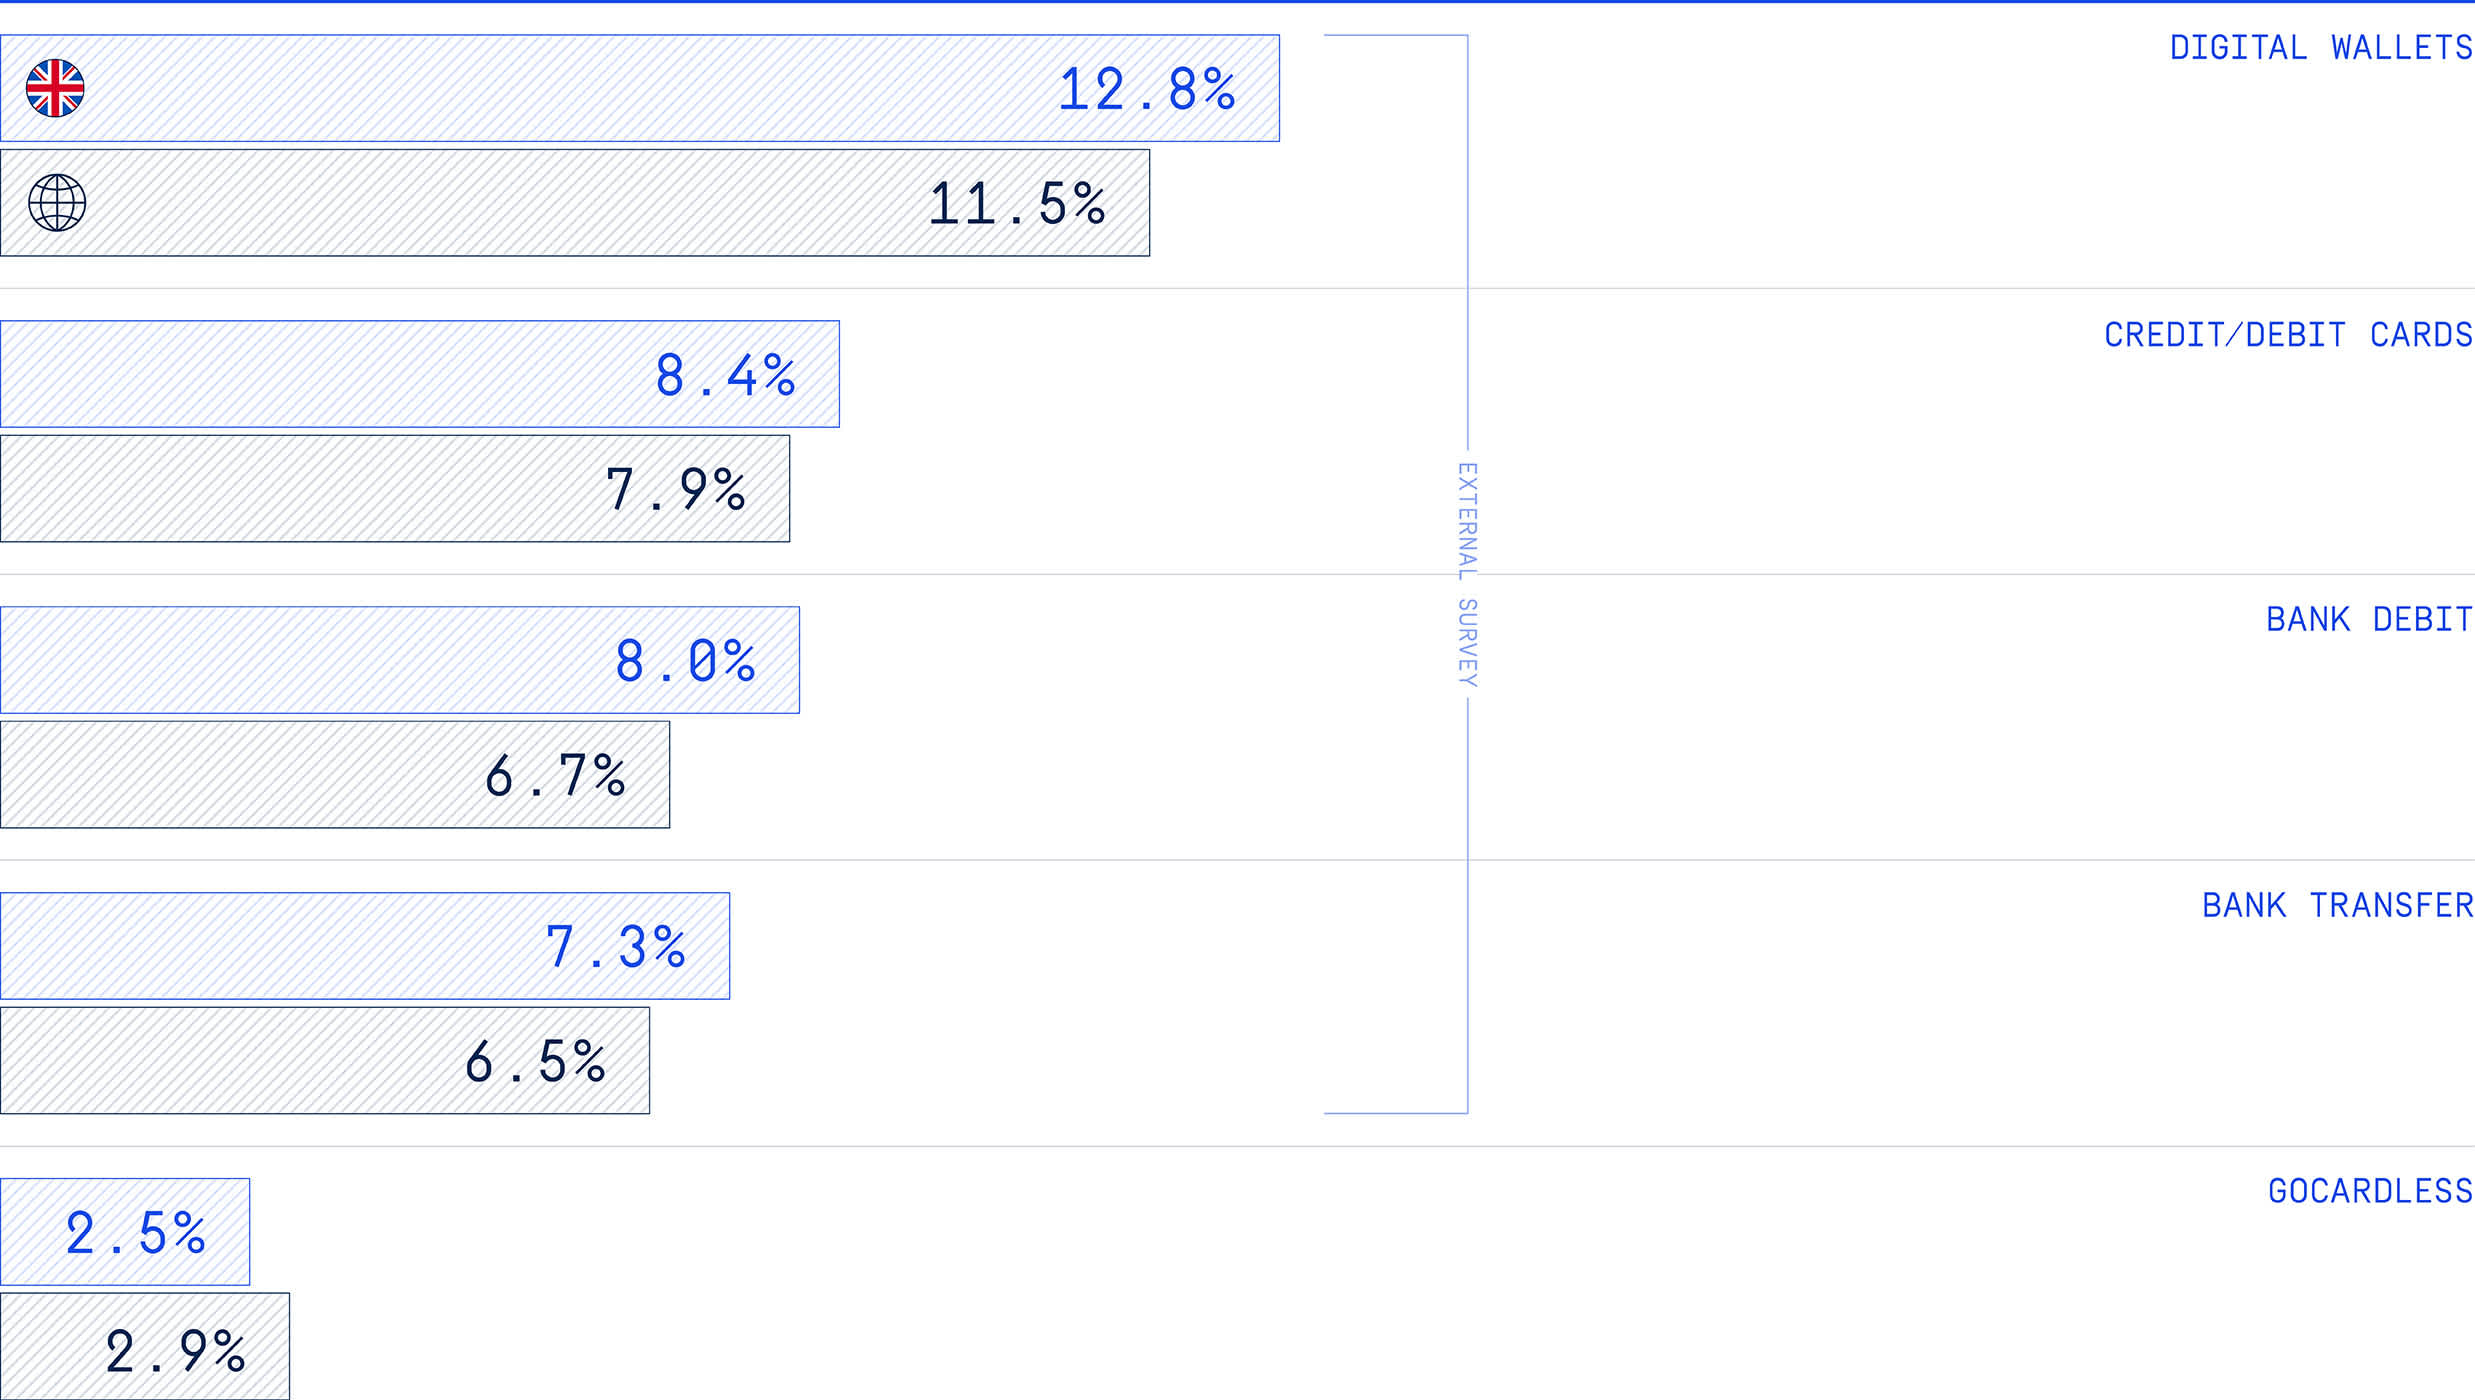
GoCardless payments are all collected using direct debit (referred to as bank debit globally). Other common payment methods for collecting recurring payments include credit/debit cards, bank transfer, and digital wallets. In an external survey of 500 UK businesses,* those collecting primarily with digital wallets have the highest failure rates (12.8%), with credit/debit card payments the next most likely to fail at 8.4%.
This is comparable with global failure rates across other payment methods. In every market, businesses primarily collecting with digital wallets had the highest average failure rates.
4. UK & Ireland Enterprise businesses stand to lose almost £800k per year in uncollected payments.
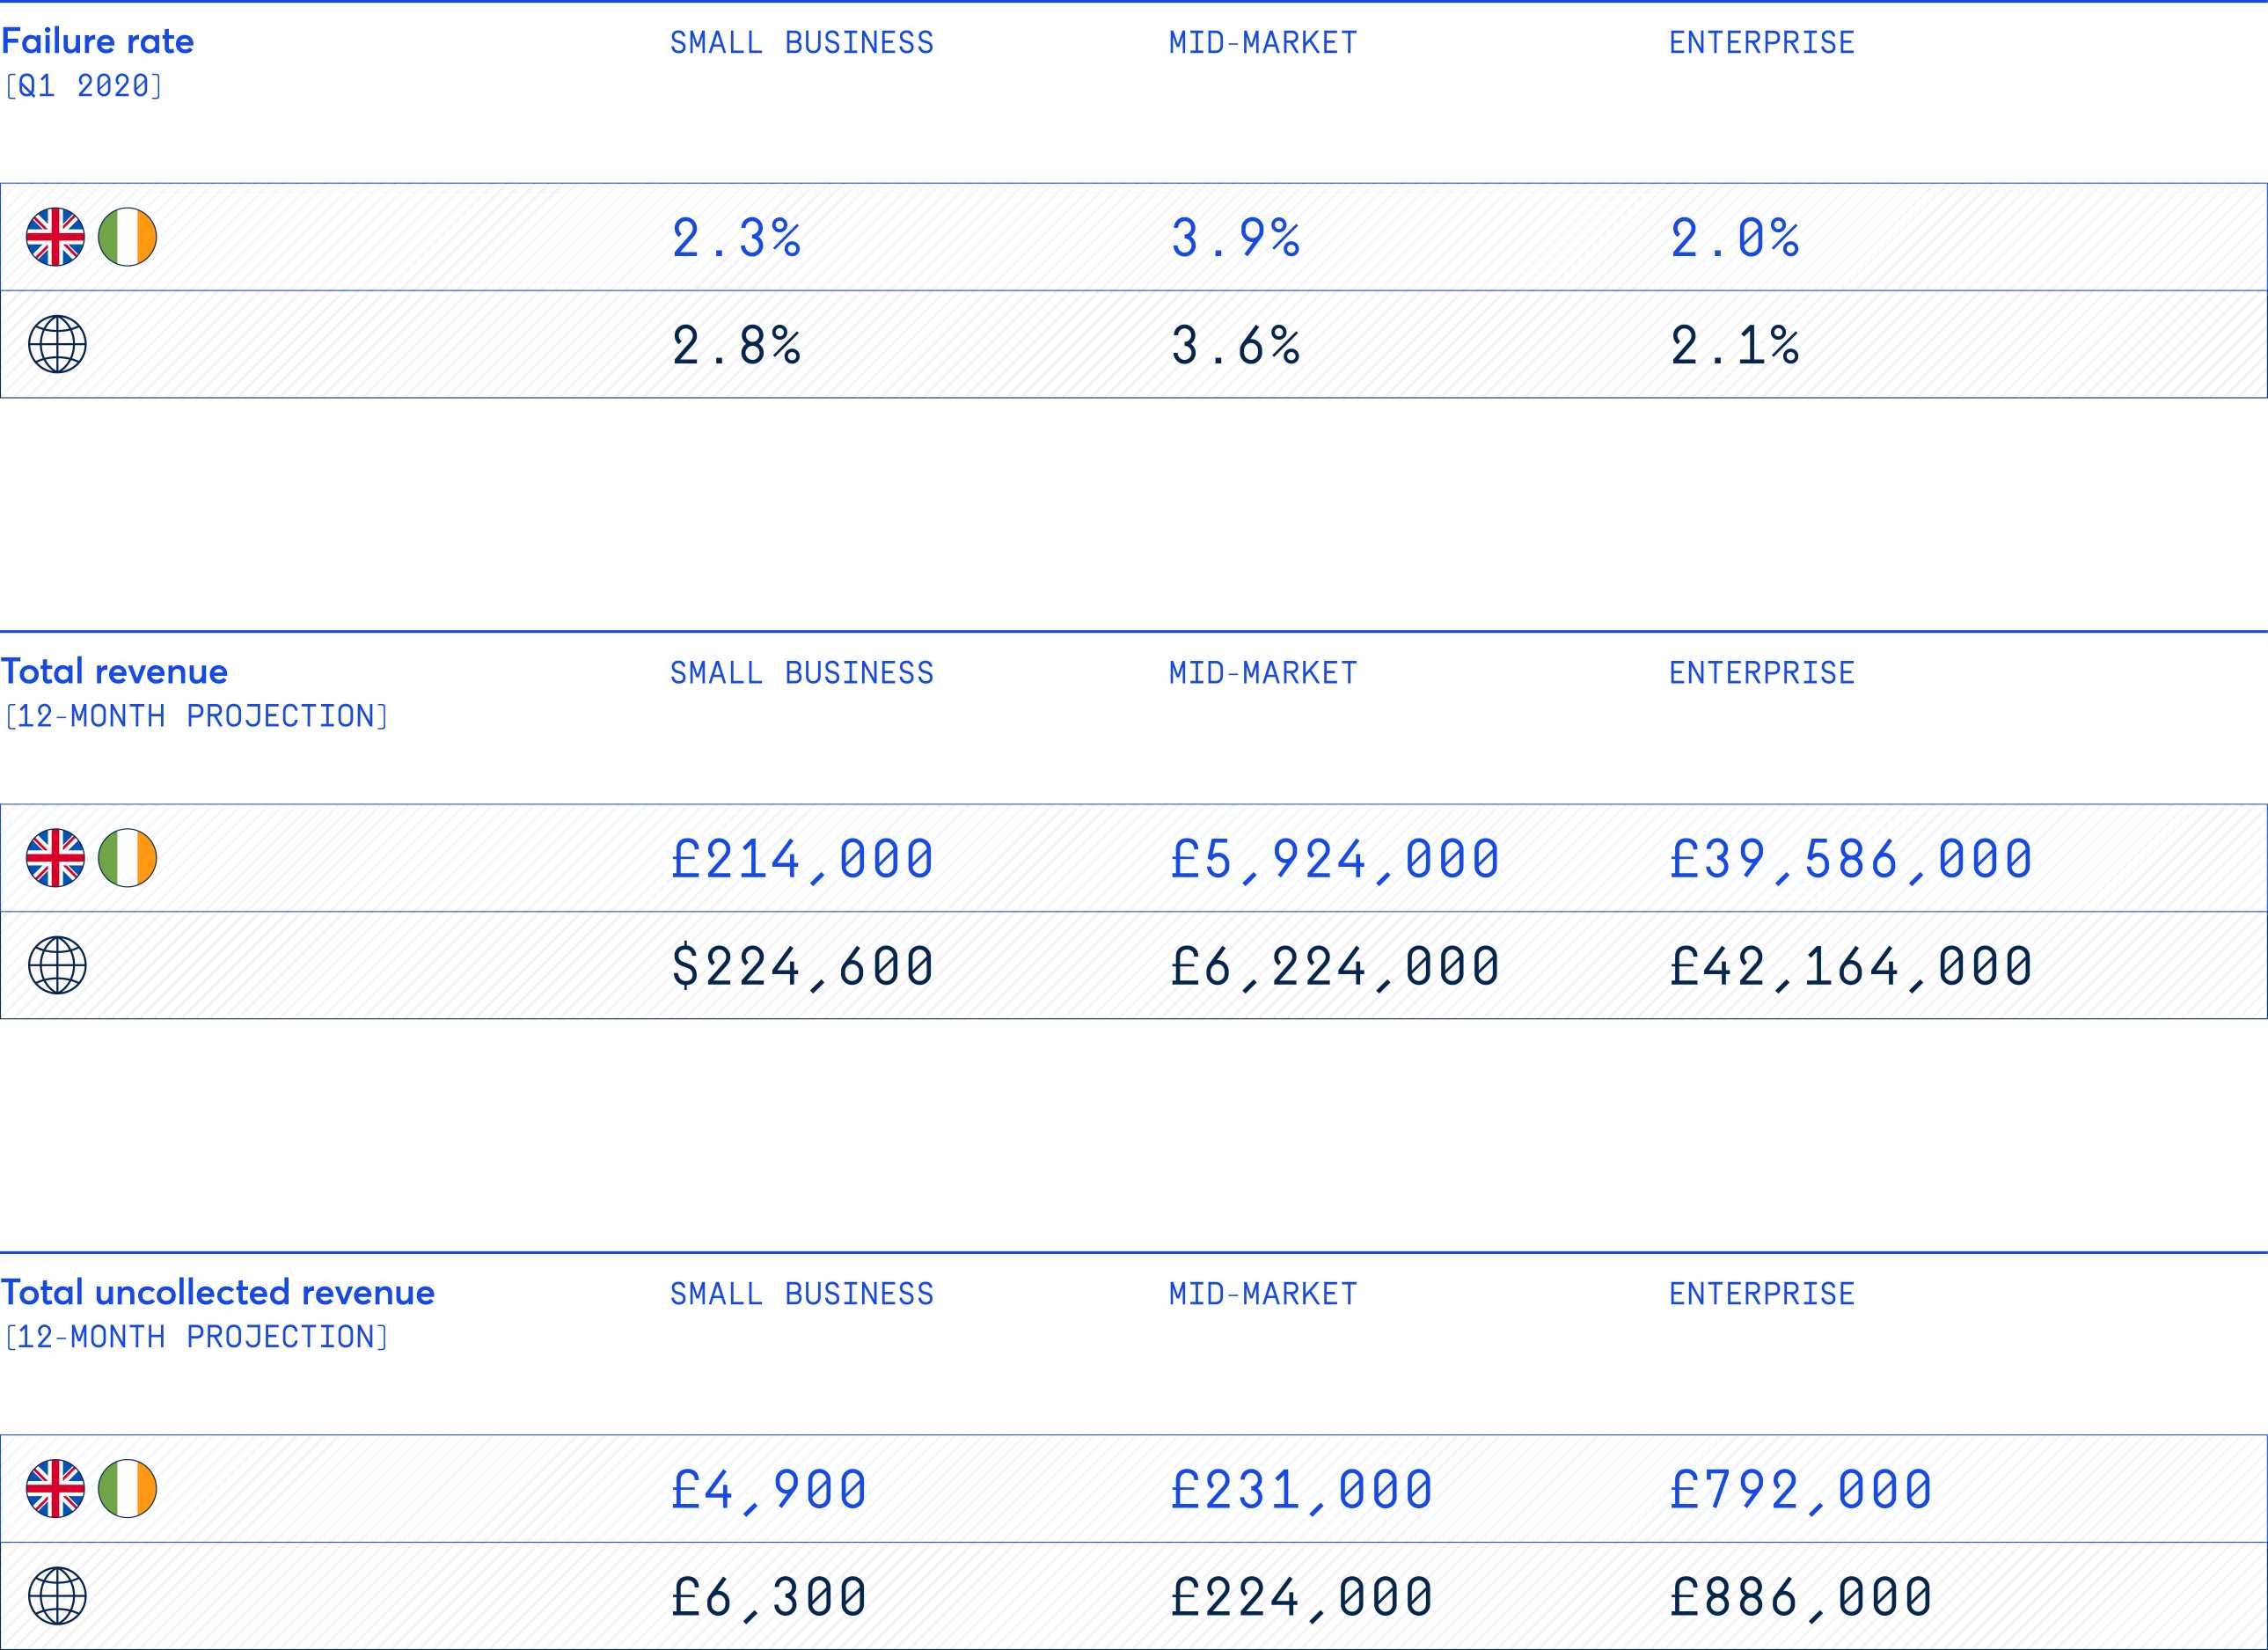
When comparing businesses by their size**, mid-market businesses have the highest failure rates at 3.9%, followed by small businesses (2.3%) and then enterprise (2%).
But despite having the lowest failure rates, the large payment volumes in a typical UK or Ireland enterprise business mean uncollected revenue quickly adds up. A typical enterprise business will lose approximately ~£790,000 every year in uncollected revenue.
5. Payments over $250 have a significantly higher failure rate than lower-value payments.
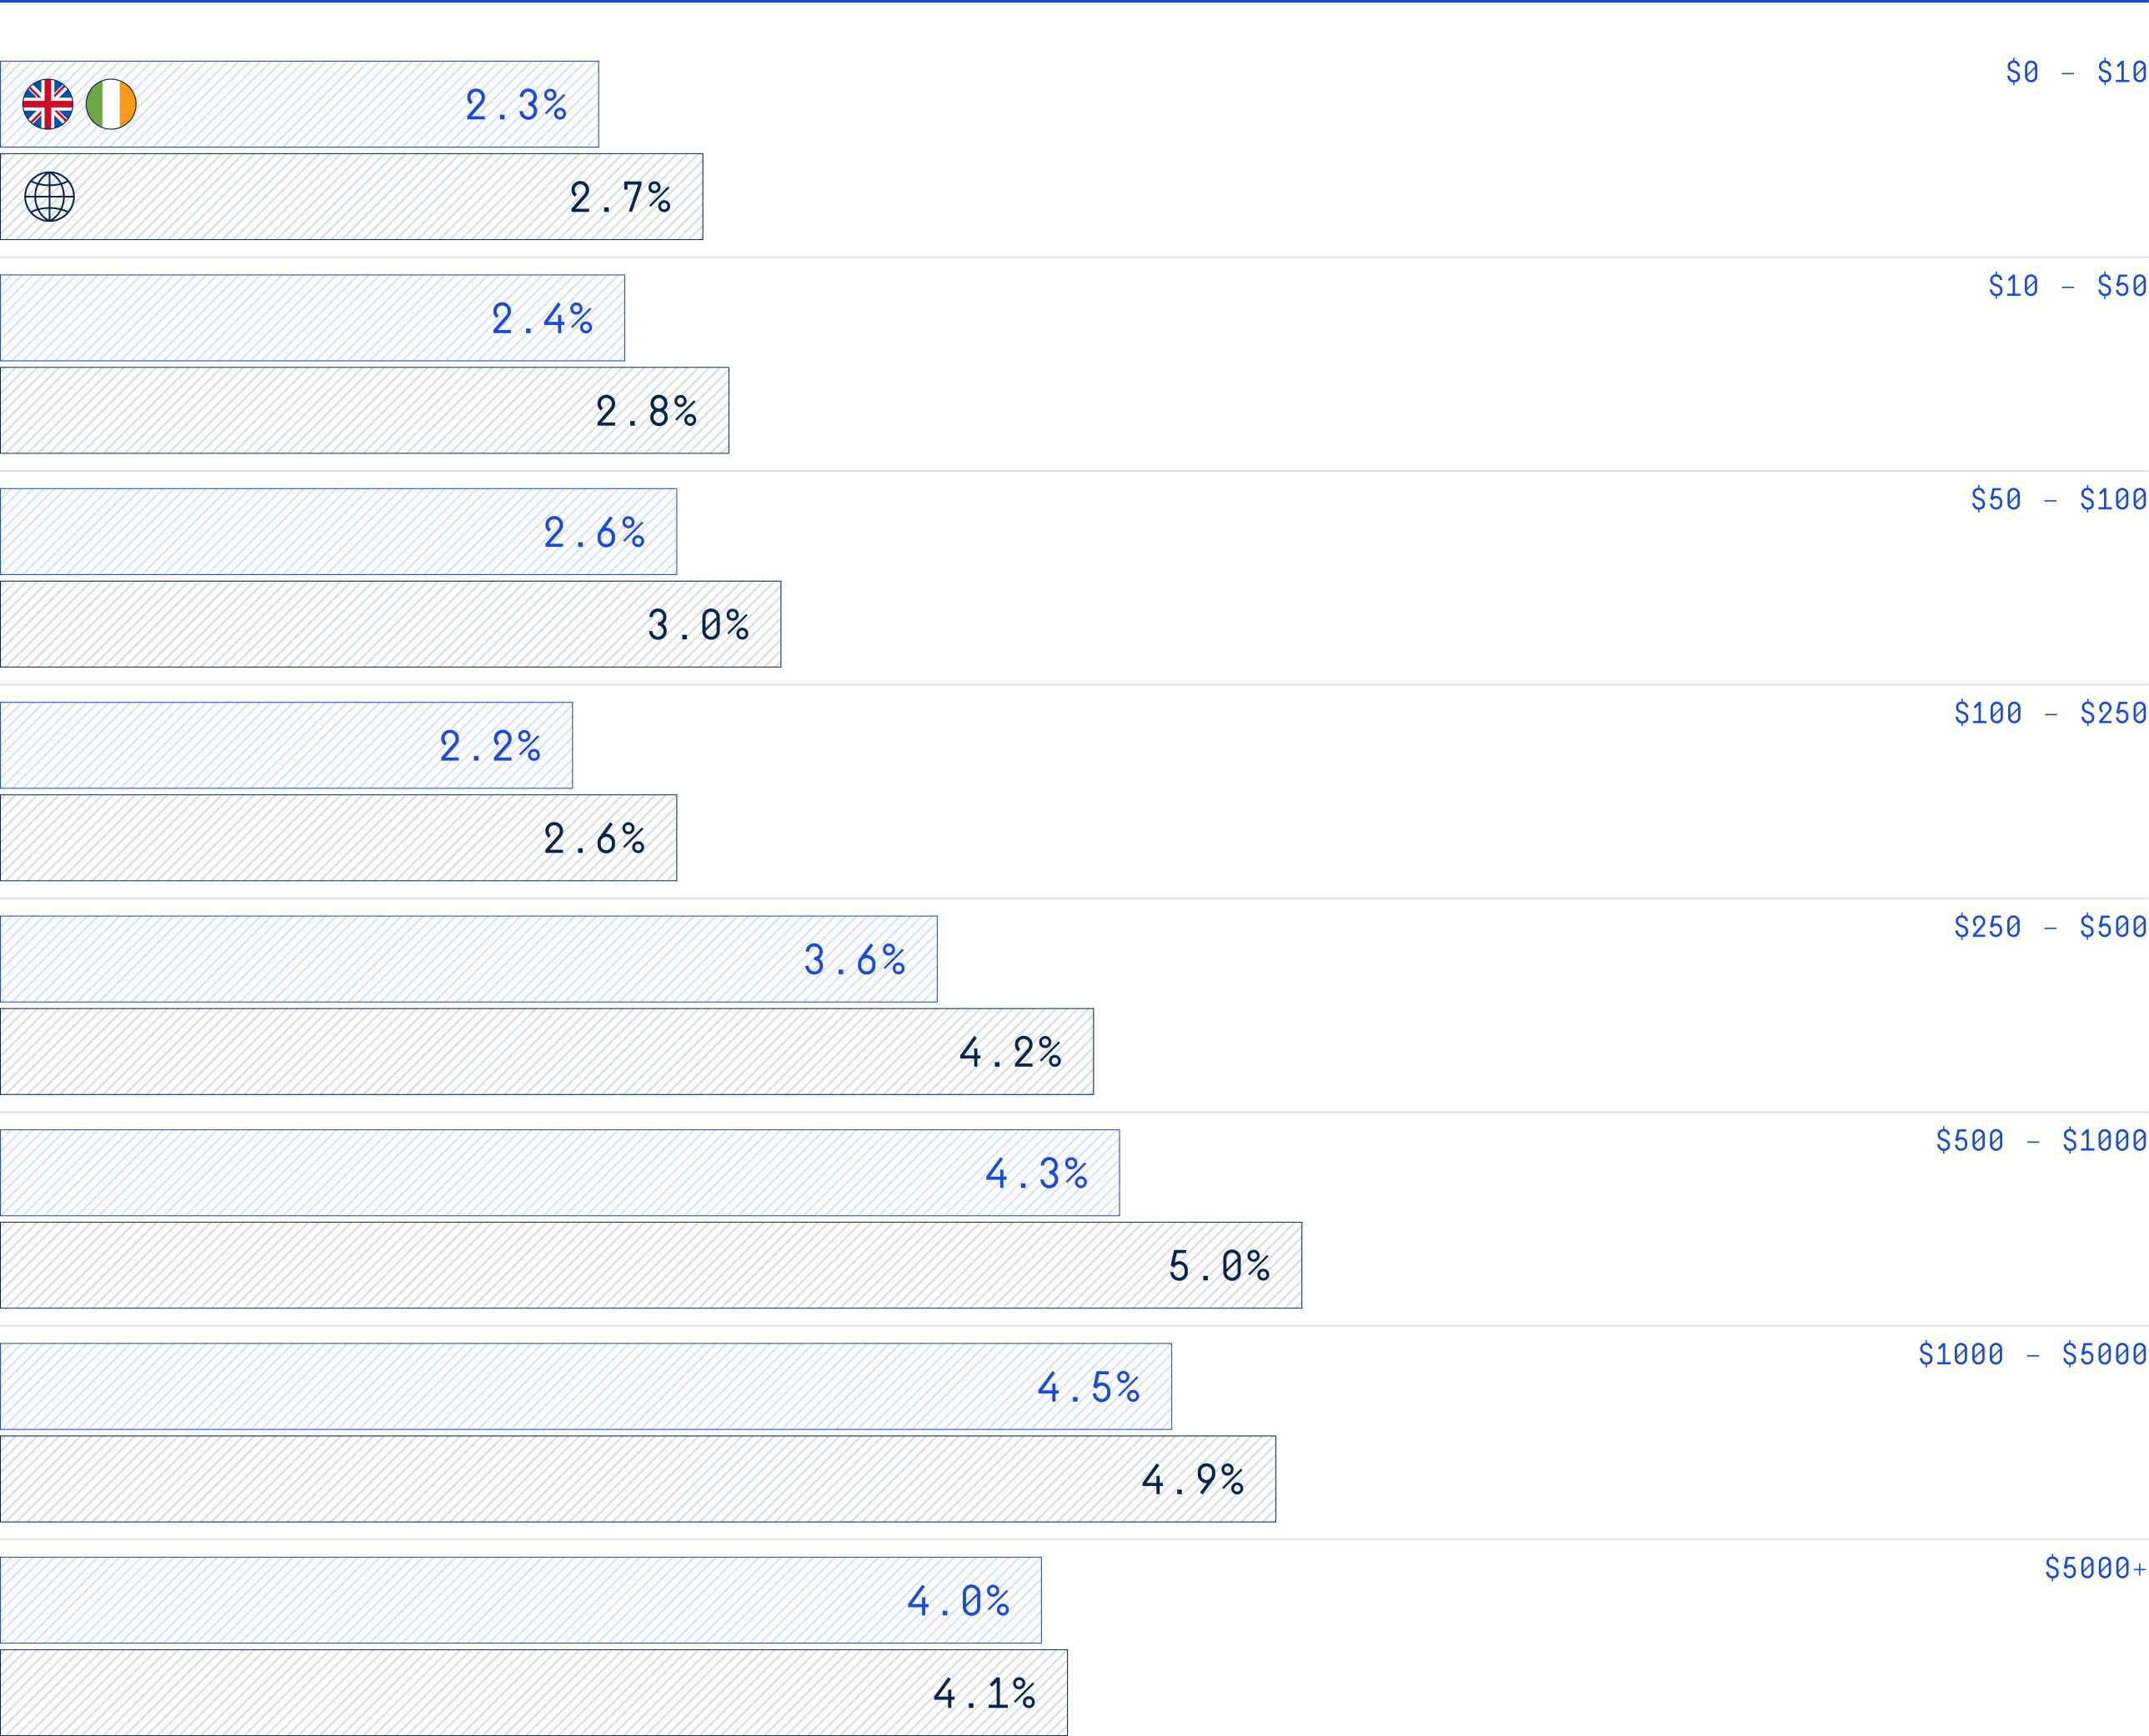
For payments between $0-250, UK & Ireland businesses experience failure rates of between 2.2% and 2.6%, depending on the payment bracket. But for payments above $250, the failure rate jumps to anywhere from 3.6% to 4.5%. Payments from $1000-5000 are most likely to fail (4.5%).
This disparity shows that, for smaller payments, an automated retry approach may yield improvements, while high-value payments will warrant a tailored approach to each failure.
Calculate your business’ failure rate
Your payment failure rate is calculated as:

Number of uncollected payments ÷ Total number of attempted collections = Payment failure rate (%)
How does your brand’s payment failure rate compare to the UK & Ireland benchmark? And how much of your annual revenue remains uncollected as a result?
Chasing failed payments involves awkward conversations, which damage relationships with customers. And eventually, uncollected payments become bad debt you’ll never collect on. Payment failures also lead to involuntary churn, where an otherwise happy customer can’t make a payment.
As you can see, optimising your payment experience has benefits for your brand and your customers. It’s never too early in your company’s journey to put in place a payment process you can rely on.
The payment success index 2020
We analysed 55,000 payments to bring you the most comprehensive insights on payment failure rates. Download the report and see how your brand compares.
*The external survey of 500 merchants only included business based in the UK.
**Small businesses are those with up to £10 million in annual revenue. Mid-market businesses are those with £10-250 million in annual revenue. Enterprise businesses are those with £250 million or more annual revenue.

