The 8 dimensions of recurring payments: how to build an optimised payment strategy

Last editedJune 20217 min read
What makes the perfect recurring payment strategy? Is it getting the most value for your money? Is it offering the best customer experience? Is it dependability? Or is it a combination of all of these and more?
And how do you begin to measure all these aspects of your payment strategy?
It’s these kinds of questions we’ve pondered at GoCardless for years. With our 60,000-strong customer base, we’ve helped businesses with their entire recurring payment operations. But we wanted to understand exactly where GoCardless excels and where we can still offer something extra.
Through a careful process of analysing payment data and consulting our customers, we’ve settled on a framework we call the 8 dimensions of recurring payments.
This framework has been useful for GoCardless to continuously improve what we do, and more importantly, it’s been transformative for our customers too.
And we also realised it’s useful beyond the world of GoCardless. It doesn’t matter which payment provider or payment method(s) you’re using, if you collect recurring payments (e.g. subscriptions, invoices or instalments), you should measure your payment strategy around this framework.
Why should I use the 8 dimensions of recurring payments?
There are two key ways the 8 dimensions framework can help your business:
1. Find, optimise and measure hidden inefficiencies and untapped growth levers in your payment strategy.
2. Compare the inherent strengths and weaknesses of different payment methods and payment providers to decide which are best for your business.
What are the 8 dimensions that make up the framework?
The 8 dimensions and their definitions are:
Coverage: A measure of payers who could choose a payment method
Preference: A measure of payers who do choose a payment method
Conversion: A measure of payers who complete your payment process
Success: A measure of payments that are successfully collected and retained
Visibility: A measure of how long it takes to receive actionable information on a payment
Cost: The total cost of building, operating and processing payments
Cashflow: A measure of the number of days it takes to settle a payment from the point it becomes a receivable
Churn: A measure of payers that your business is incapable of collecting from, after a given time period
In the definitions above, it’s worded to apply to a single payment method but you can easily combine the different payment methods you offer to understand your overall payment process.
How do all 8 dimensions fit together?
You can break the framework down into three broad areas:
Customer acquisition
Recurring payment operations
Impact
The chart below shows how the dimensions connect to build to form the entire recurring payment process.
But what does each area mean?
Customer acquisition
Customer acquisition is about increasing the size of your payment funnel, to maximise the number of customers you win. Improving Coverage, Preference and Conversion lead to a bigger and better-converting payment funnel.
Recurring payment operations
Once you’ve won a customer, the next step is to increase their lifetime value. To do this, you need to optimise Cost, Success and Visibility. You need to make sure you decrease your total cost of handling payments (not just your transaction fee). You also need to make sure the highest possible percentage of your payments are successfully collected. And you need to make sure you have the right information about every payment.
Impact
Recurring payment operations lead to outcomes in the final stage: Impact. Optimising your recurring payment operations will lead to lower customer Churn and better Cashflow.
How do I put the framework into practice?
As mentioned above, the framework acts as a scoring chart for your entire recurring payment strategy. To score your payment method(s), or perhaps a new payment method you’re considering, use the following metrics to quantify each one.
By using the same metrics every time you use the framework, you get the added value of benchmarking your payment strategy over time or when adding/changing payment methods.
We’ll walk you through each dimension in detail, and we’ve also added benchmarks for each one using research we’ve worked on with the IDC, Forrester and YouGov, plus some of GoCardless’ own internal data and customer stories.
1. Coverage
Coverage is the measure of payers who could choose the payment method. It’s all about how many people the merchant can reach with their payment method, paying particular attention to the number of countries that can be reached, and the number of people that can be reached in those countries.
Metric: Percentage of payers covered by the payment method
Benchmark: Zuora
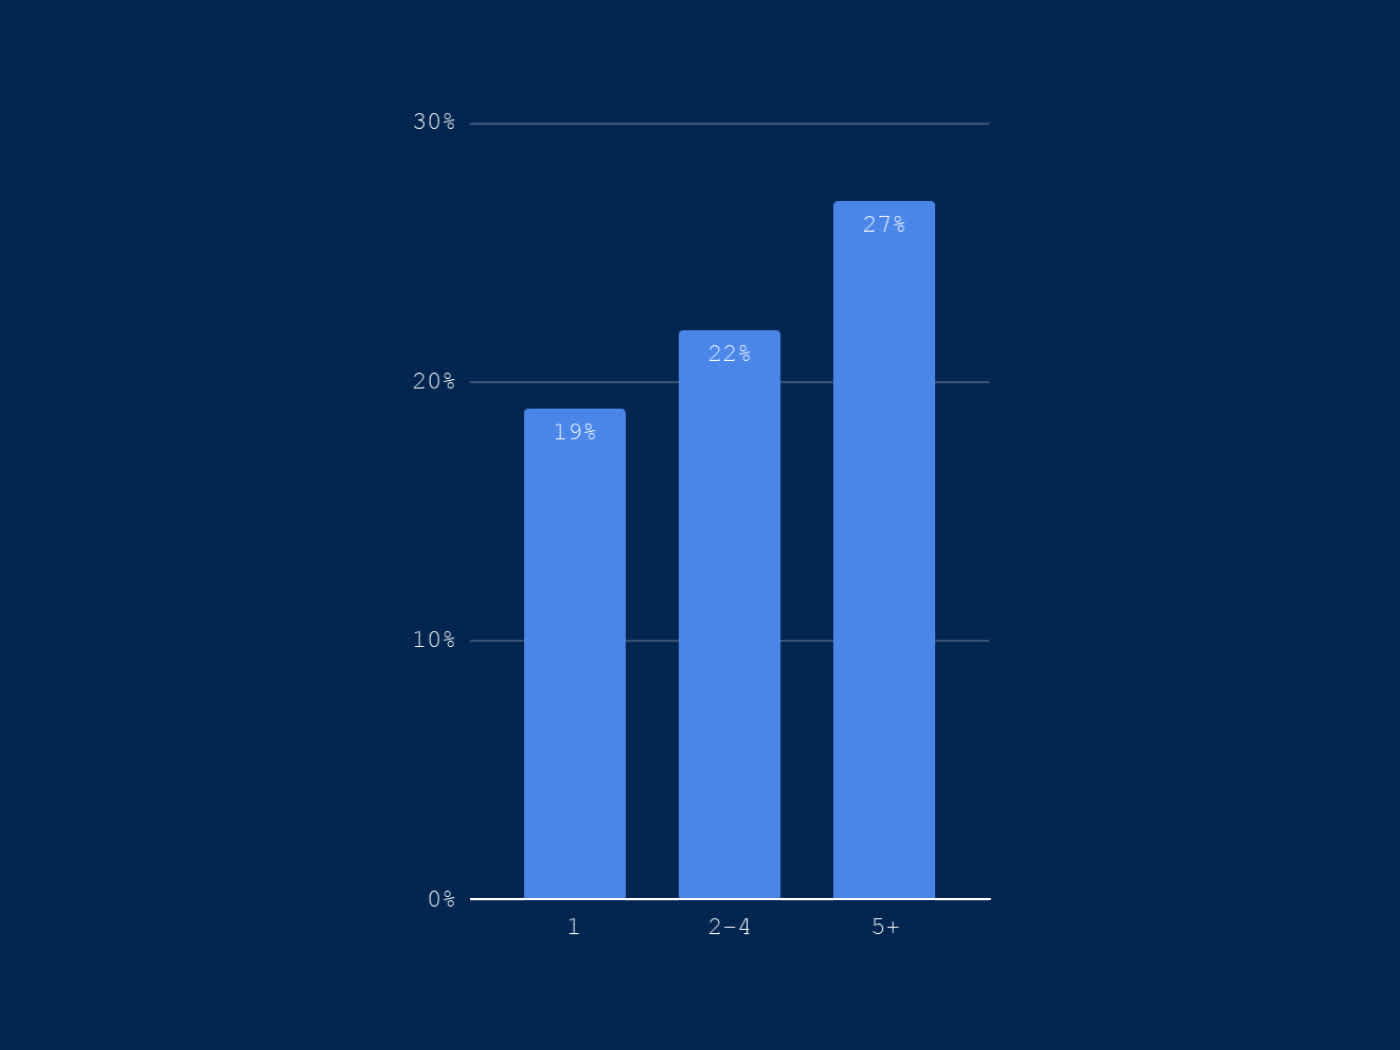
Zuora found that businesses accepting five or more currencies grow 8% faster than those that only accept one:
1 currency - 19% growth rate
2-4 currencies - 22% growth rate
5+ currencies - 27% growth rate

Business growth rate by the number of currencies accepted. Source: Zuora
2. Preference
Preference is the measure of payers who choose the payment method. Some prefer to pay with a credit card, some with cheques and some with digital wallets. If you don’t offer the right payment methods, some potential customers will drop out of the payment flow.
There isn’t one single payment method that all customers prefer. It varies by use case and country. This is the reason many businesses offer multiple payment methods to cater for different preferences.
Metric: Percentage of payers who choose the payment method
Benchmark: The global payment preferences report (YouGov and GoCardless)
Taking the B2B research as an example, bank debit (known as Direct Debit in the UK), is the preferred payment method in six out of nine countries when it comes to paying digital for subscriptions.
And Zuora research shows that businesses that accept more payment methods grow their customer base faster. Companies that accept more than five payment methods have, on average, 4% higher subscriber growth than those that accept three or fewer.
3. Conversion
Conversion is the measure of payers who complete the payment process. When potential customers land on a payment page, not all of them will complete the payment process. Lots can go wrong, the payment page could time out, it could be poorly built with too many steps or the potential customer might not have payment details to hand.
Metric: Percentage payment page conversion rate
Example: The impact of Strong Customer Authentication on conversion
In a study commissioned by GoCardless, we asked 1,900 businesses across UK, France, Germany, USA, Australia about their payment flows and their payment page conversion rate, and the impact of Strong Customer Authentication (SCA).
56% of respondents said SCA has had a detrimental effect on their payment page conversion.
It’s worth noting that card payments are subject to SCA, while bank debit is not, showing a direct link between payment page conversion rate and the payment methods you use to collect those payments.
4. Cost
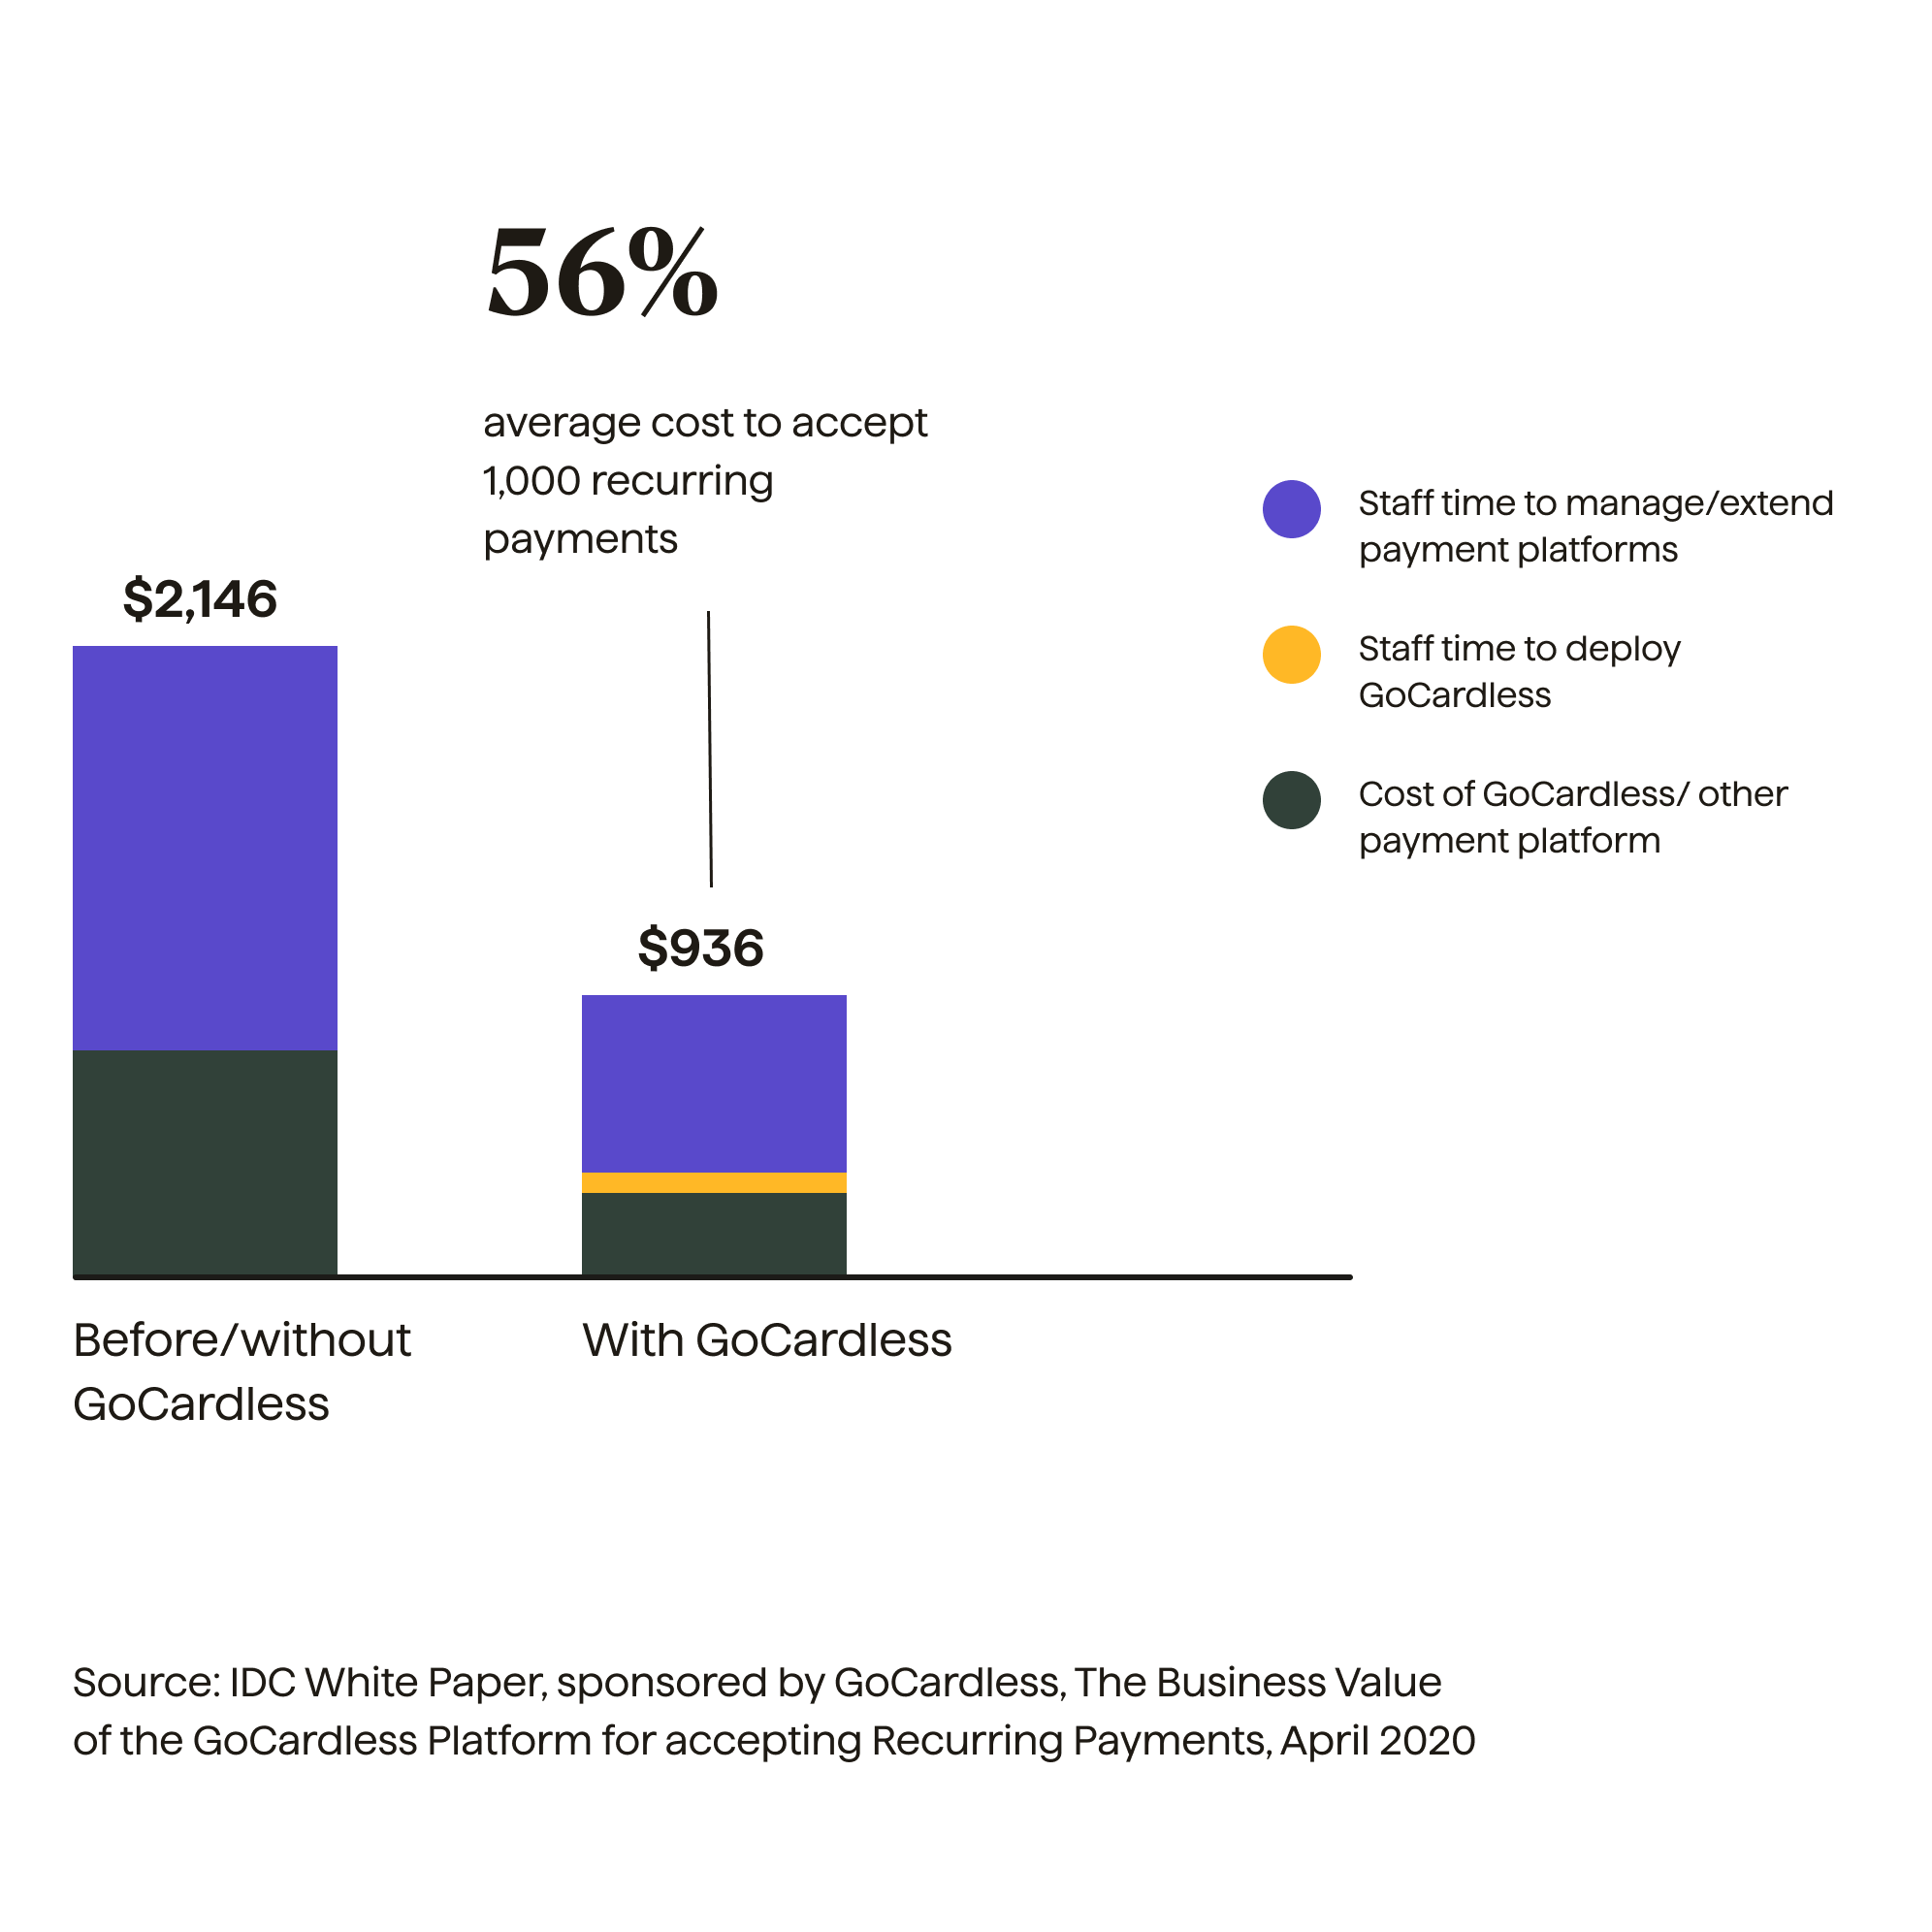
Cost is the measure of how much a payment method costs to build, operate and process. There are lots of costs to consider when it comes to taking payments. Transaction fees are important, but it is a misconception that this is the only cost to look at. The total cost of ownership includes not only transaction fees, but also integration costs, staff costs, recovery costs and more.
Metric: Total cost of ownership
Benchmark: Rethink Your Payment Strategy To Save Your Customers And Bottom Line (Forrester Consulting)
Commissioned by GoCardless, Forrester consulting carried out a detailed survey of 700 payment decision-makers and found that on average, B2C businesses spend 11%-15% of the payment value trying to recover failed payments and B2B businesses spend 16%-20%.
The data in the full report goes into detail on the cost of payments failing and the cost of recovering those payments that fail.

5. Success
Success is the measure of your payments that are successfully collected and retained. When you attempt to collect a payment from your customer, a lot of things can go wrong. They might not have the money, their payment method might not be working e.g. expired card, or your customer’s bank might not allow the payment to happen. And even when the payment is successful, your customer might charge it back.
Metrics:
Percentage of first-time failures
Percentage of total failures (after retries)
Percentage of chargebacks
Benchmark: The GoCardless payment success index
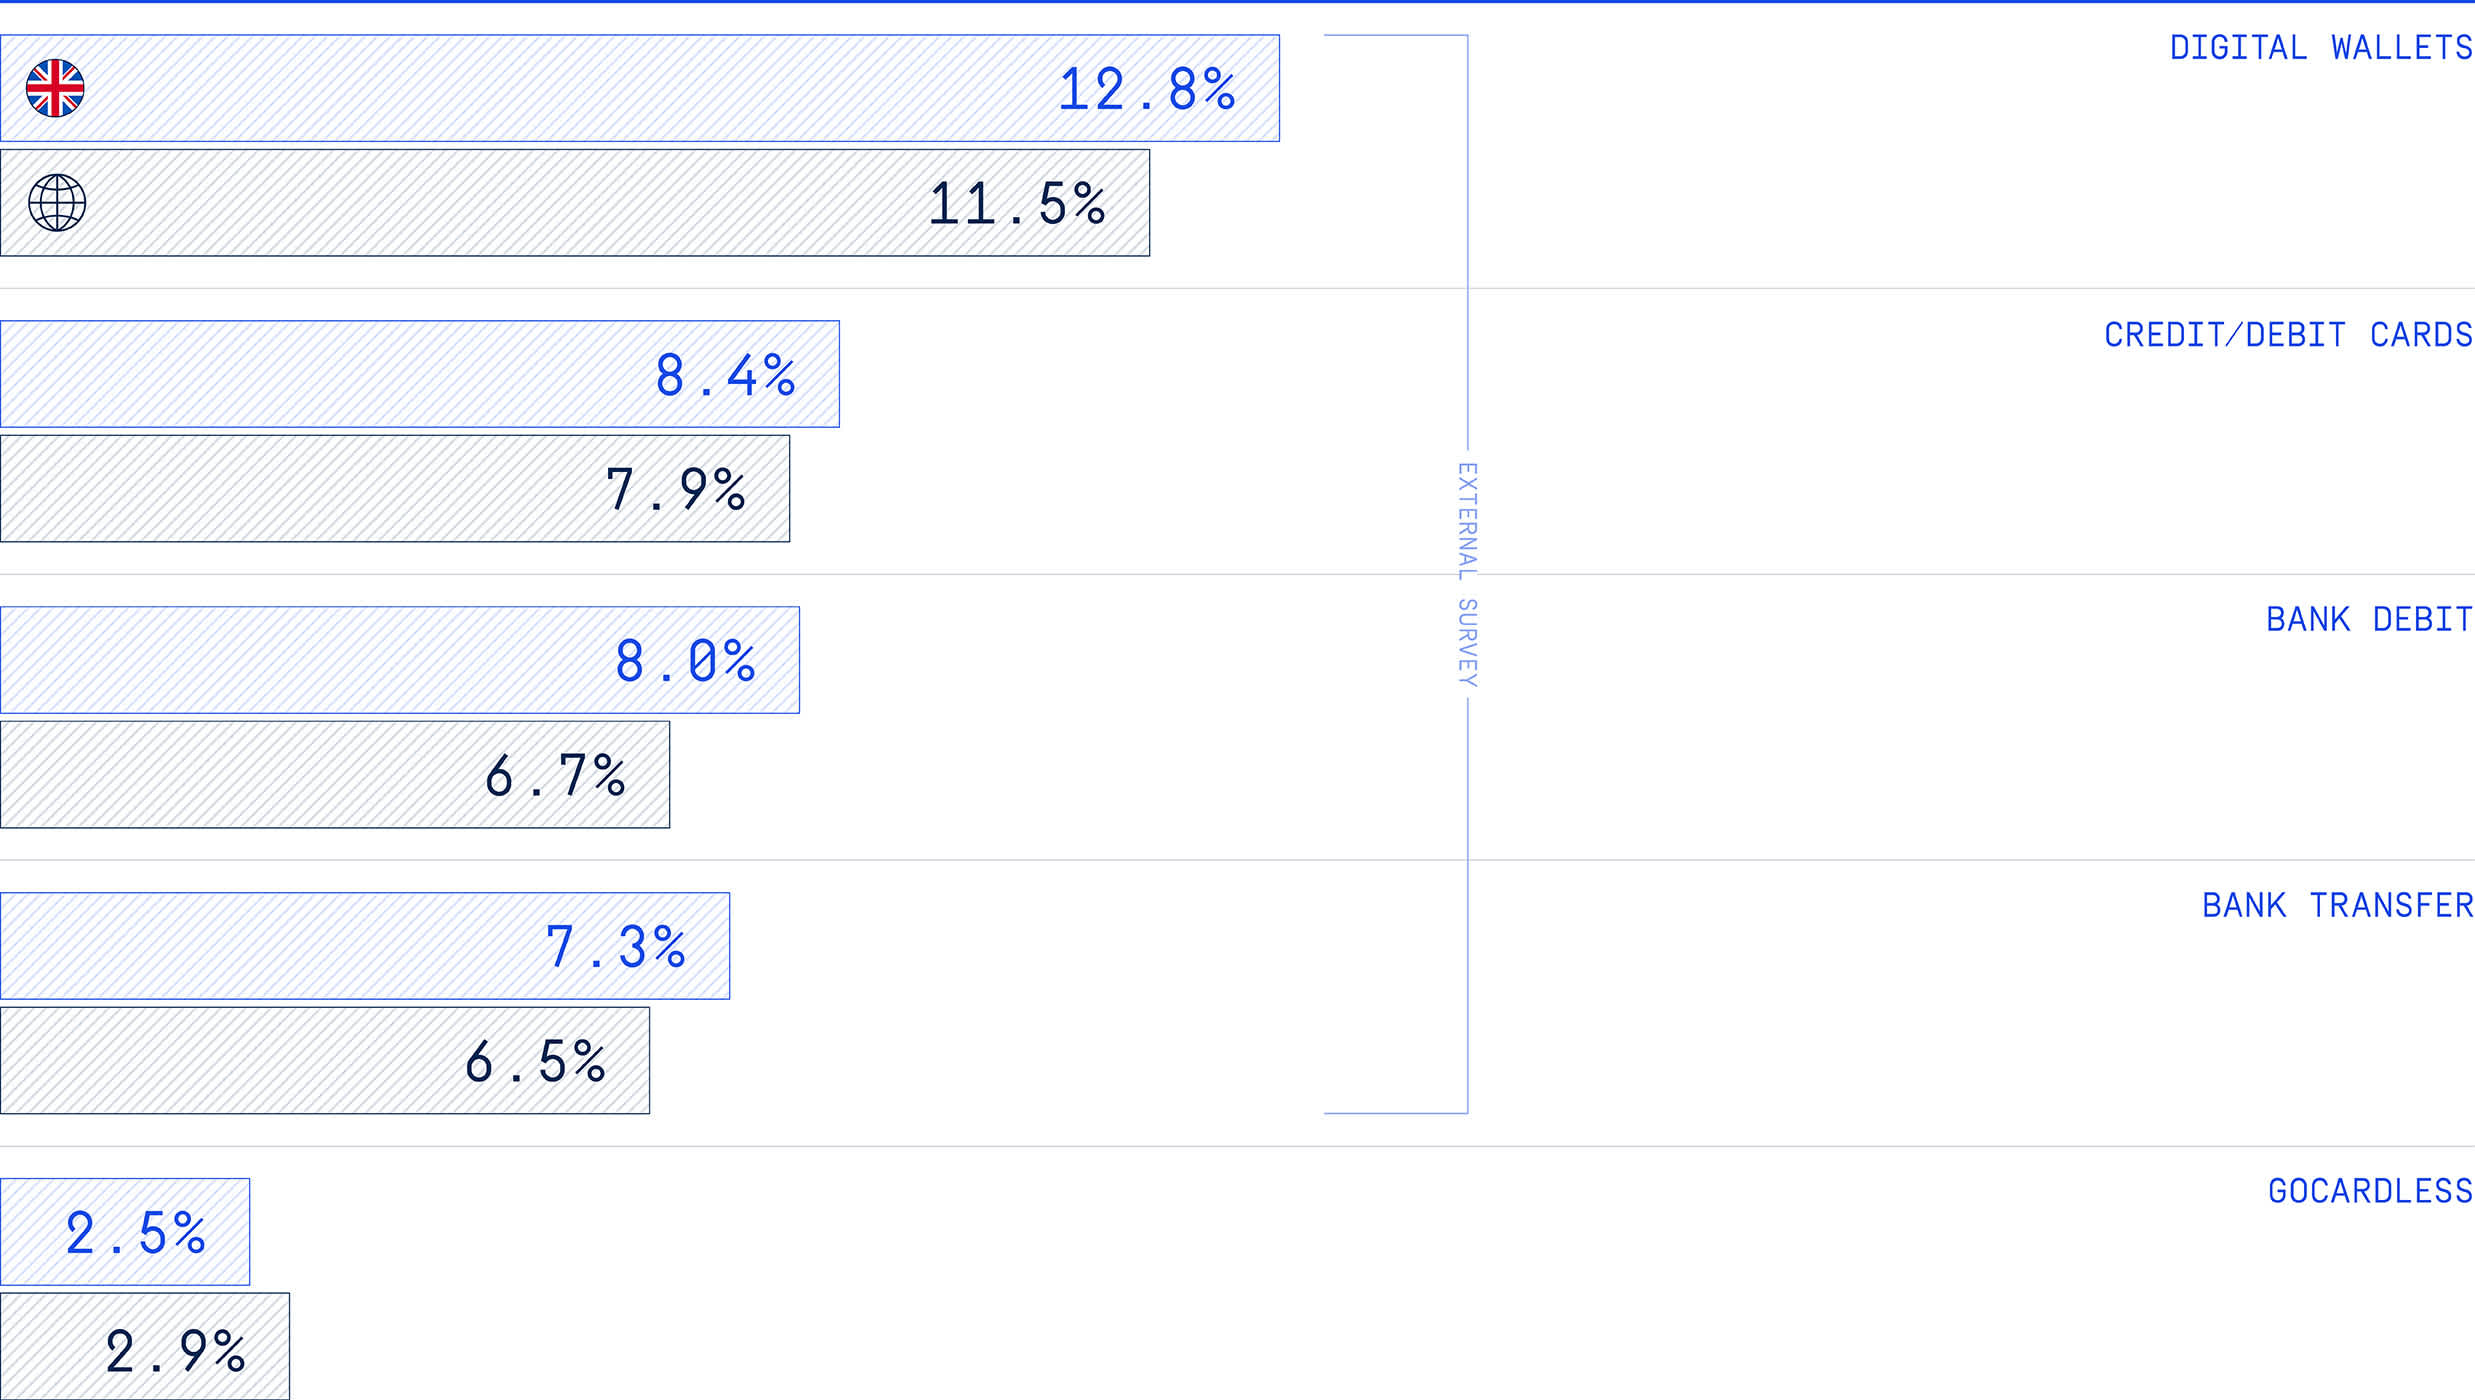
In early 2020, we analysed the data of over 55,000 GoCardless customers, as well as surveying hundreds of other businesses using a mix of different payment methods and found the average failure rates vary dramatically.
Digital wallets had the highest failure rates of any primary payment method at 11.5%, with credit/debit cards close behind at 6.5%. Bank debit has an average failure rate of 6.7%, while bank transfer has the lowest of the four methods we analysed, at 6.5%.
GoCardless, using our recurring payments platform built on top of bank debit, has an average failure rate of just 2.9% at the first attempt.

Payment failure rates by payment method (UK & global data). Source: The GoCardless payment success index
6. Visibility
Visibility is a measure of how long it takes to receive actionable information on a payment. Visibility is about how fast it takes a business to receive information about a payment from their bank, but it’s also about the depth of the information they receive. For example, can you quickly get information on if and why a payment has failed? Without that crucial 2nd part, it’s a lot more difficult to take action.
Metric: Average number of days to receive actionable information about a payment
Example: The British Journal of Photography
“[Before GoCardless] we were unable to provide a good experience for customers. Money would land in our account, but we had no visibility on where it came from, and which payments weren’t coming in on time.”
Marc Hartog, CEO, British Journal of Photography
7. Cashflow
Cashflow is the measure of how long it takes to settle a payment when it has become a receivable. Cashflow has a huge impact on businesses of all sizes. When you’re waiting to receive the money you’re owed, it prevents you from putting that money to work elsewhere.
Metric: Average number of days to settle a payout, once it becomes a receivable
Benchmark: Rethink Your Payment Strategy To Save Your Customers And Bottom Line (Forrester Consulting)
Forrester consulting carried out a detailed survey of 700 payment decision-makers, including asking them about their typical DSO (day sales outstanding).
The report found that on average, 4 out of 5 businesses have a DSO of higher than 20 days. This means the median DSO is 21-30 days. By comparison, companies like Autotask have reduced their DSO to just 3.5 days using GoCardless.
8. Churn
The final dimension, churn, is a measure of the payers that a business is incapable of collecting from after a given period. Churn is a widely discussed concept for SaaS businesses, with numerous strategies and tactics for reducing it and retaining more customers. But your payment provider plays a key role in involuntary churn.
For clarity...
Voluntary churn is when a customer decides to stop using your product or service. Involuntary churn is when a customer loses access to your product or service for a reason beyond their control, e.g. their regular subscription payment fails.
Metric: % of churn/renewal, % of involuntary churn
Benchmark: Rethink Your Payment Strategy To Save Your Customers And Bottom Line (Forrester Consulting)
In the same 700-person survey already mentioned above, Forrester Consulting determined that, on average, failed payments result in churn 11-15% of the time. If your business has a failure rate of 10% - not totally uncommon - then up to 1.5% of your customer base churns every month. And that’s just the involuntary side of churn.
What should I do next?
Once you’ve scored your payment operations against the 8 dimensions you’ll have a much better idea of where your strengths and weaknesses lie.
It could be that your customer acquisition funnel is healthy, but your recurring payment operations are adding unnecessary cost and complexity, and slowing down further growth. The clarity that comes from using the framework makes it much easier to make decisions on how to further improve your payment strategy.
Further optimisation might include a few simple tweaks, but it could equally require more serious changes - possibly even adding or changing your payment provider.
Try asking your current payment provider the following questions. You’ll get a good sense of how much they can help.
To find out more about how GoCardless can transform your recurring payment strategy, improve your payment success rates and reduce your costs, start here.
